
Want to catch up with other articles from this series?
- The straight dope on cholesterol – Part I
- The straight dope on cholesterol – Part II
- The straight dope on cholesterol – Part III
- The straight dope on cholesterol – Part IV
- The straight dope on cholesterol – Part V
- The straight dope on cholesterol – Part VI
- The straight dope on cholesterol – Part VII
- The straight dope on cholesterol – Part VIII
- The straight dope on cholesterol – Part IX
In Part I, Part II, Part III and Part IV of this series, we addressed these 6 concepts:
#1 — What is cholesterol?
#2 — What is the relationship between the cholesterol we eat and the cholesterol in our body?
#3 — Is cholesterol bad?
#4 — How does cholesterol move around our body?
#5 – How do we measure cholesterol?
#6 – How does cholesterol actually cause problems?
Quick refresher on take-away points from previous posts, should you need it:
- Cholesterol is “just” another fancy organic molecule in our body but with an interesting distinction: we eat it, we make it, we store it, and we excrete it – all in different amounts.
- The pool of cholesterol in our body is essential for life. No cholesterol = no life.
- Cholesterol exists in 2 forms – unesterified or “free” (UC) and esterified (CE) – and the form determines if we can absorb it or not, or store it or not (among other things).
- Much of the cholesterol we eat is in the form of CE. It is not absorbed and is excreted by our gut (i.e., leaves our body in stool). The reason this occurs is that CE not only has to be de-esterified, but it competes for absorption with the vastly larger amounts of UC supplied by the biliary route.
- Re-absorption of the cholesterol we synthesize in our body (i.e., endogenous produced cholesterol) is the dominant source of the cholesterol in our body. That is, most of the cholesterol in our body was made by our body.
- The process of regulating cholesterol is very complex and multifaceted with multiple layers of control. I’ve only touched on the absorption side, but the synthesis side is also complex and highly regulated. You will discover that synthesis and absorption are very interrelated.
- Eating cholesterol has very little impact on the cholesterol levels in your body. This is a fact, not my opinion. Anyone who tells you different is, at best, ignorant of this topic. At worst, they are a deliberate charlatan. Years ago the Canadian Guidelines removed the limitation of dietary cholesterol. The rest of the world, especially the United States, needs to catch up. To see an important reference on this topic, please look here.
- Cholesterol and triglycerides are not soluble in plasma (i.e., they can’t dissolve in water) and are therefore said to be hydrophobic.
- To be carried anywhere in our body, say from your liver to your coronary artery, they need to be carried by a special protein-wrapped transport vessel called a lipoprotein.
- As these “ships” called lipoproteins leave the liver they undergo a process of maturation where they shed much of their triglyceride “cargo” in the form of free fatty acid, and doing so makes them smaller and richer in cholesterol.
- Special proteins, apoproteins, play an important role in moving lipoproteins around the body and facilitating their interactions with other cells. The most important of these are the apoB class, residing on VLDL, IDL, and LDL particles, and the apoA-I class, residing for the most part on the HDL particles.
- Cholesterol transport in plasma occurs in both directions, from the liver and small intestine towards the periphery and back to the liver and small intestine (the “gut”).
- The major function of the apoB-containing particles is to traffic energy (triglycerides) to muscles and phospholipids to all cells. Their cholesterol is trafficked back to the liver. The apoA-I containing particles traffic cholesterol to steroidogenic tissues, adipocytes (a storage organ for cholesterol ester) and ultimately back to the liver, gut, or steroidogenic tissue.
- All lipoproteins are part of the human lipid transportation system and work harmoniously together to efficiently traffic lipids. As you are probably starting to appreciate, the trafficking pattern is highly complex and the lipoproteins constantly exchange their core and surface lipids.
- The measurement of cholesterol has undergone a dramatic evolution over the past 70 years with technology at the heart of the advance.
- Currently, most people in the United States (and the world for that matter) undergo a “standard” lipid panel, which only directly measures TC, TG, and HDL-C. LDL-C is measured or most often estimated.
- More advanced cholesterol measuring tests do exist to directly measure LDL-C (though none are standardized), along with the cholesterol content of other lipoproteins (e.g., VLDL, IDL) or lipoprotein subparticles.
- The most frequently used and guideline-recommended test that can count the number of LDL particles is either apolipoprotein B or LDL-P NMR, which is part of the NMR LipoProfile. NMR can also measure the size of LDL and other lipoprotein particles, which is valuable for predicting insulin resistance in drug naïve patients, before changes are noted in glucose or insulin levels.
- The progression from a completely normal artery to a “clogged” or atherosclerotic one follows a very clear path: an apoB containing particle gets past the endothelial layer into the subendothelial space, the particle and its cholesterol content is retained, immune cells arrive, an inflammatory response ensues “fixing” the apoB containing particles in place AND making more space for more of them.
- While inflammation plays a key role in this process, it’s the penetration of the endothelium and retention within the endothelium that drive the process.
- The most common apoB containing lipoprotein in this process is certainly the LDL particle. However, Lp(a) and apoB containing lipoproteins play a role also, especially in the insulin resistant person.
- If you want to stop atherosclerosis, you must lower the LDL particle number.
Concept #7 – Does the size of an LDL particle matter?
There are few, if any, topics in lipidology that generate more confusion and argument that this one. I’ve been leading up to it all month, so I think the time is here to address this issue head on. I’ve read many papers and seen many lectures on this topic, but the one that stole my heart was a lecture given by Jim Otvos at the ADA 66th Scientific Sessions in Washington, DC. Some of the figures I am using in this post are taken directly or modified from his talk or subsequent discussions.
At the outset of this discussion I want to point out two clinical scenarios to keep in mind:
- The most lethal lipoprotein disorder is familial hypercholesterolemia, which I have discussed in previous posts. Such patients all have large LDL particles, but most of these patients die in childhood or early adulthood if not treated with medications to reduce particle number.
- Conversely, diabetic patients and other patients with advanced metabolic syndrome have small LDL particles, yet often live well into their 50s and 60s before succumbing to atherosclerotic diseases.
The common denominator is that both sets of patients in (1) and (2) have high LDL-P. What I’m going to attempt to show you today is that once adjusted for particle number, particle size has no statistically significant relationship to cardiovascular risk. But first, some geometry.
“Pattern A” versus “Pattern B” LDL
The introduction of gradient gel electrophoresis about 30 years ago is what really got people interested in the size of LDL particles. There is no shortage of studies of the past 25 years demonstrating that of the following 2 scenarios, one has higher risk, all other things equal. [This is a big disclaimer and I went back and forth for a while before deciding to include this point. It is an uncharacteristic oversimplification. If you’ve been reading this blog for a while, you’ll know I’m rarely accused of that sin – but I’m about to be].
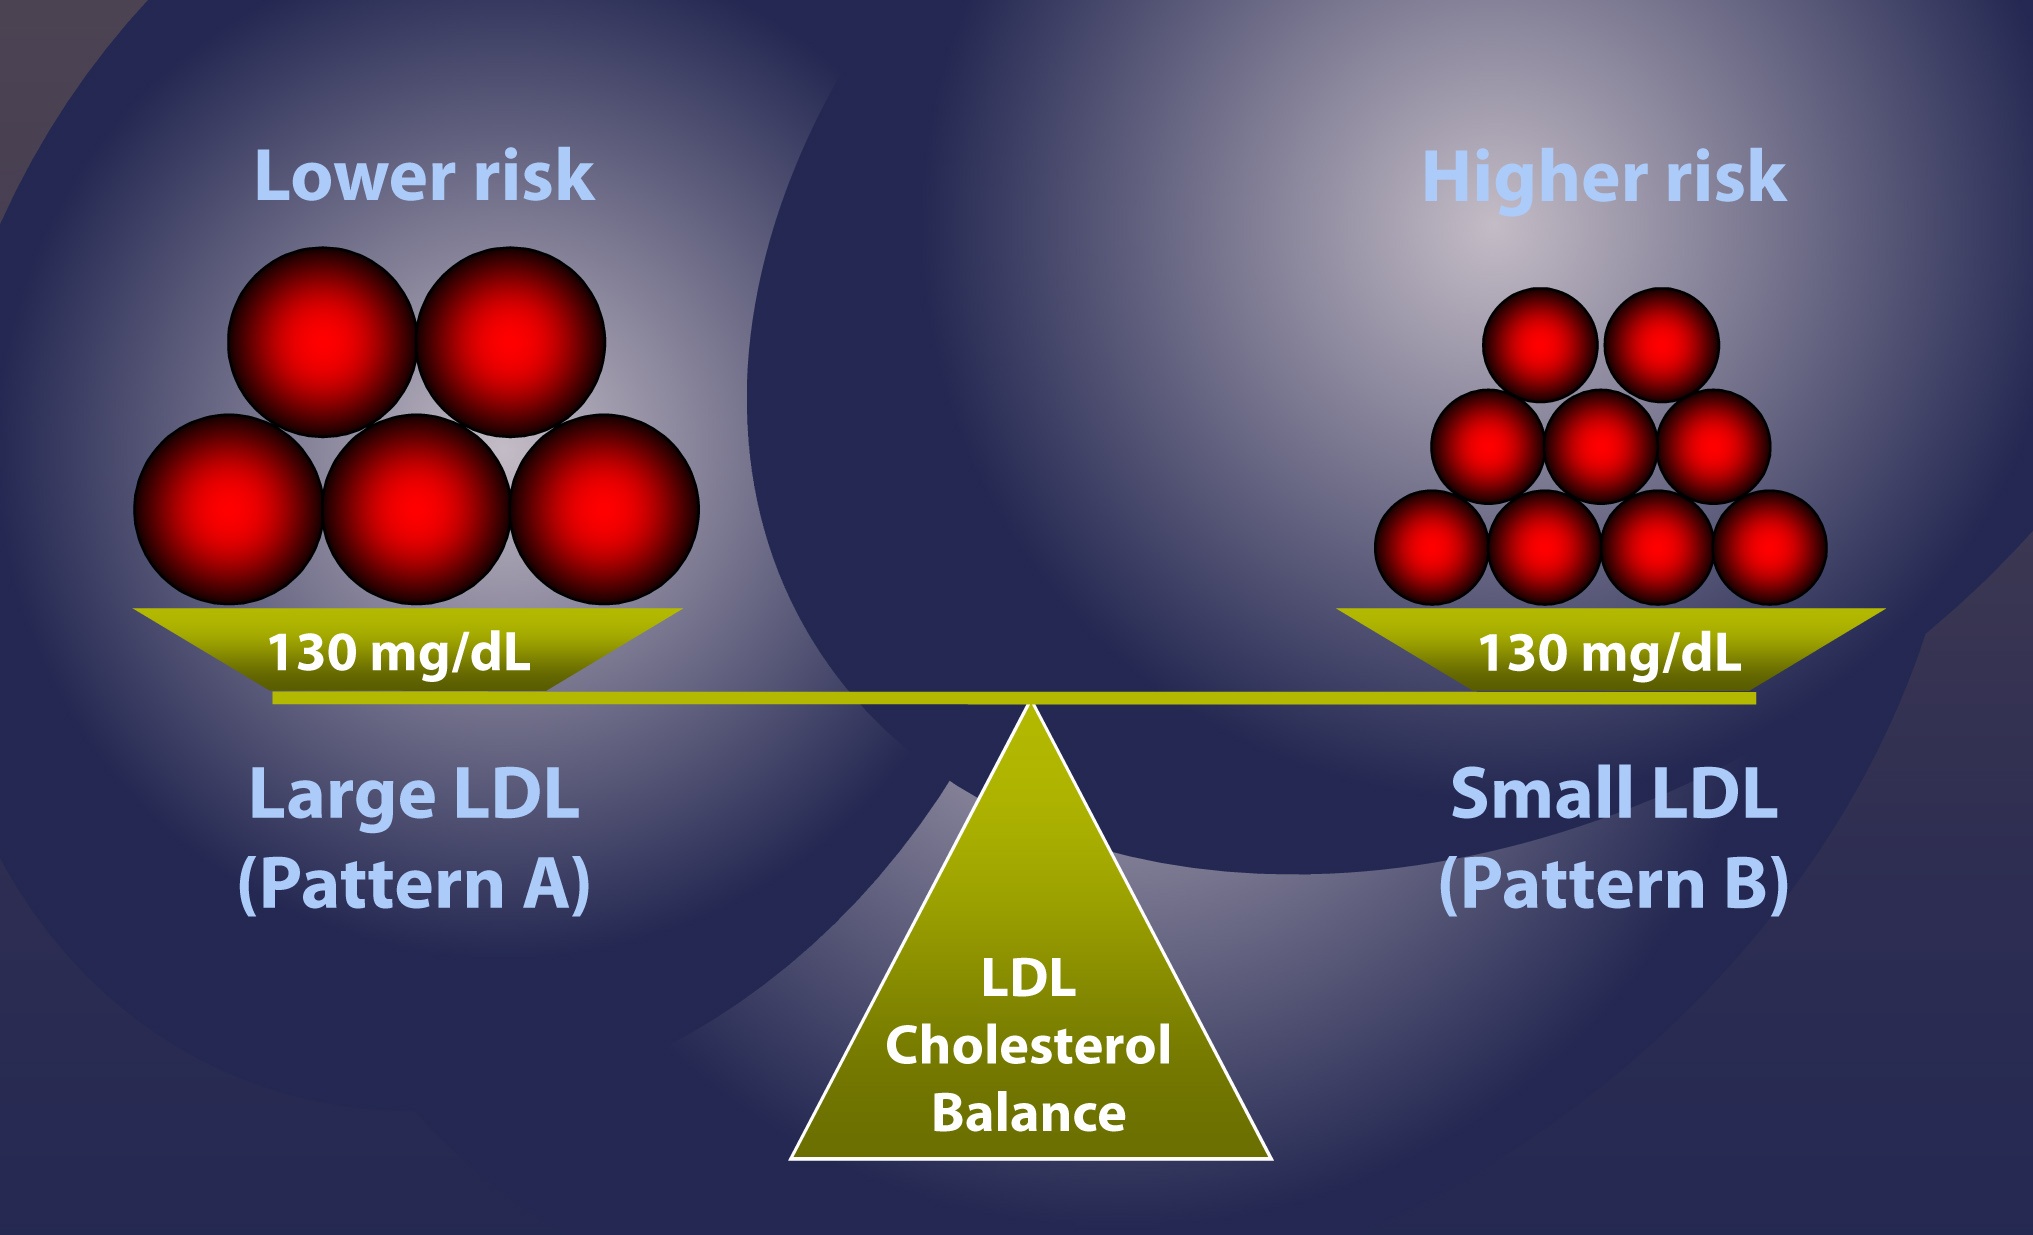
Here’s the example: Consider 2 patients, both with the same total content of cholesterol in their LDL particles, say, 130 mg/dL. Furthermore, assume each has the “ideal” ratio of core cholesterol ester-to-triglyceride (recall from Part I and III of this series, this ratio is 4:1). I’m going to explain in a subsequent post why this assumption is probably wrong as often as it’s right, but for the purpose of simplicity I want to make a geometric point.
- LDL-C = 130 mg/dL, Pattern A (large particles) – person on the left in the figure below
- LDL-C = 130 mg/dL, Pattern B (small particles) – person on the right in the figure below
Under the set of assumptions I’ve laid out, case #2 is the higher risk case. In other words, at the same concentration of cholesterol within LDL particles, assuming the same ratio of CE:TG, it is mathematically necessary the person on the right, case #2, has more particles, and therefore has greater risk.
Bonus concept: What one really must know is how many cholesterol molecules there are per LDL particle. It always requires more cholesterol-depleted LDL particles than cholesterol-rich LDL particles to traffic cholesterol in plasma, and the number of cholesterol molecules depends on both size and core TG content. The more TG in the particle, the less the cholesterol in the particle.
So why does the person on the right have greater risk? Is it because they have more particles? Or is it because they have smaller particles?
This is the jugular question I want to address today.
If you understand that the person on the right, under the very careful and admittedly overly simplified assumptions I’ve given, is at higher risk than the person on the left, there are only 4 possible reasons:
- Small LDL particles are more atherogenic than large ones, independent of number.
- The number of particles is what increases atherogenic risk, independent of size.
- Both size and number matter, and so the person on the right is “doubly” at risk.
- Neither feature matters and these attributes (i.e., size and number) are markers for something else that does matter.
Anyone who knows me well knows I love to think in MECE terms whenever possible. This is a good place to do so.
I’m going to rule out Reason #4 right now because if I have not yet convinced you that LDL particles are the causative agent for atherosclerosis, nothing else I say matters. The trial data are unimpeachable and there are now 7 guidelines around the world advocating particle number measurement for risk assessment. The more LDL particles you have, the greater your risk of atherosclerosis.
But how do we know if Reason #1, #2, or #3 is correct?
This figure (one of the most famous in this debate) is from the Quebec Cardiovascular Study, published in 1997, in Circulation. You can find this study here.
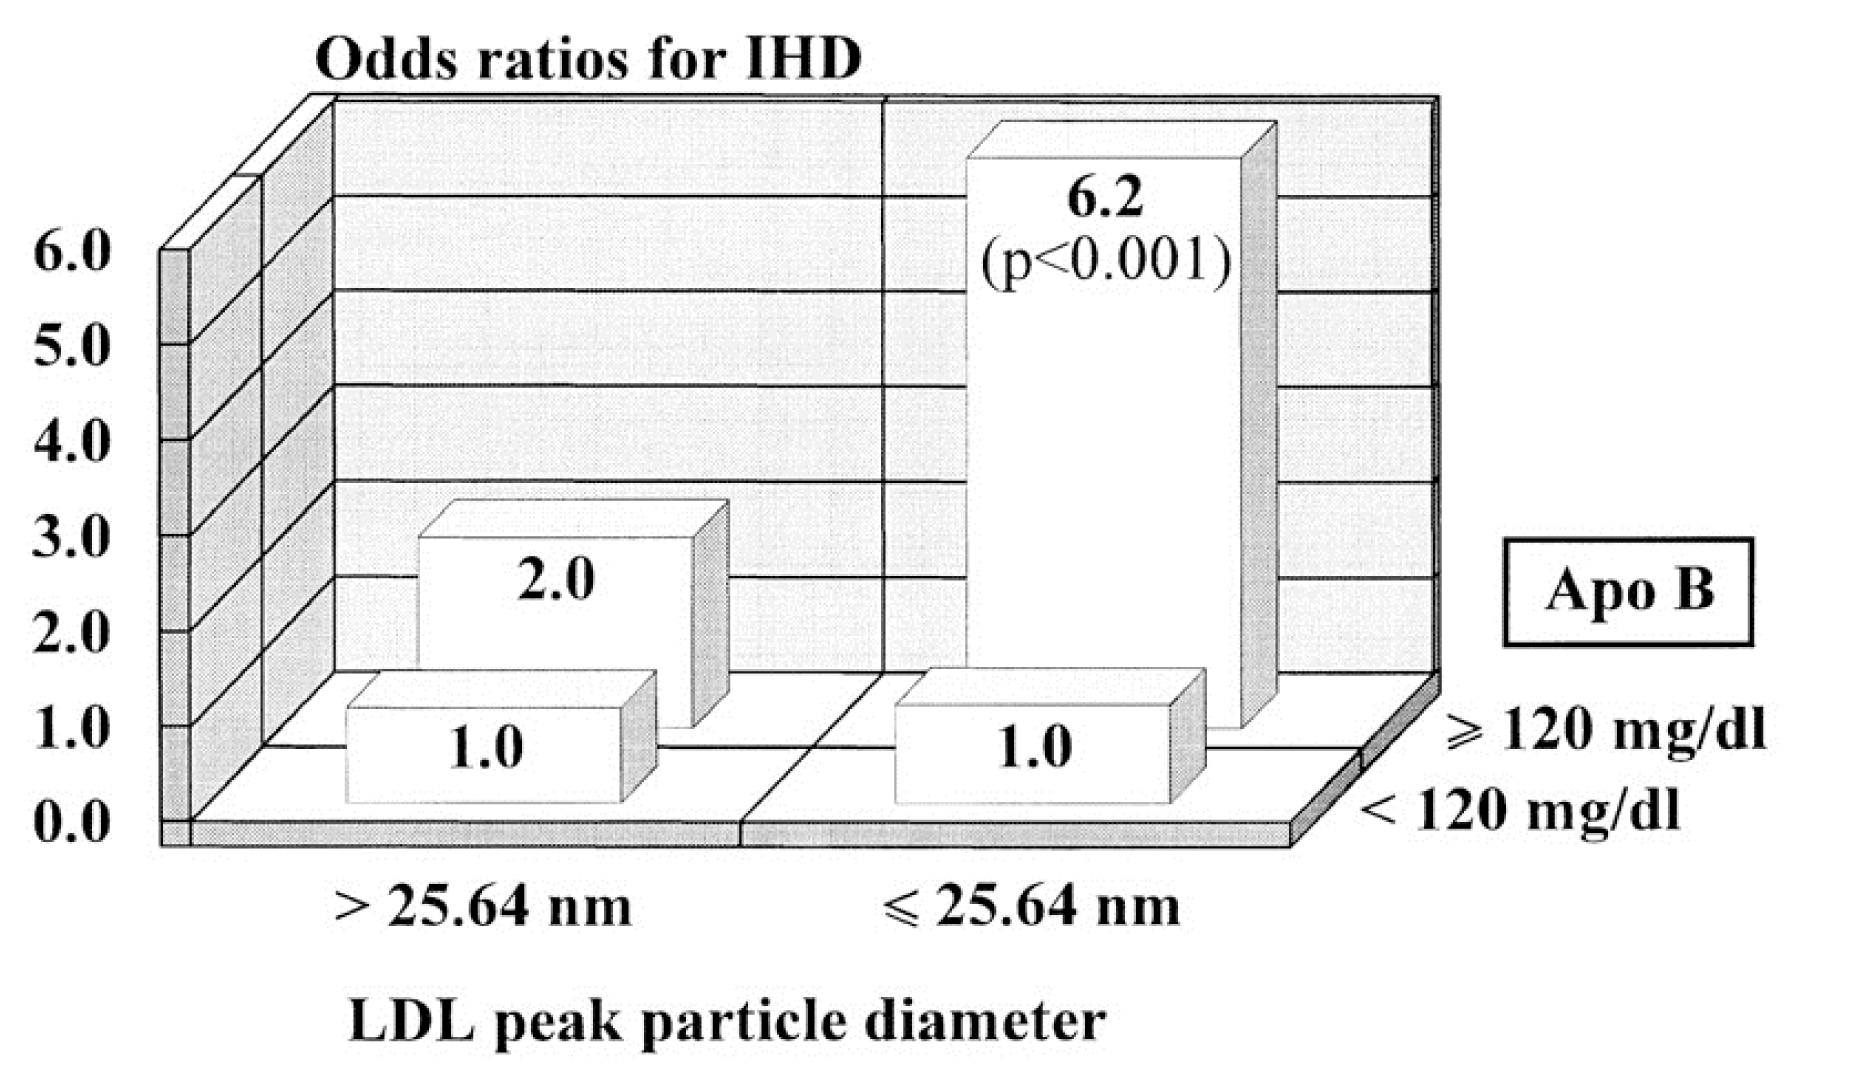
This is kind of a complex graph if you’re not used to looking at these. It shows relative risk – but in 2 dimensions. It’s looking at the role of LDL size and apoB (a proxy for LDL-P, you’ll recall from previous posts). What seems clear is that in patients with low LDL-P (i.e., apoB < 120 mg/dl), size does not matter. The relative risk is 1.0 in both cases, regardless of peak LDL size. However, in patients with lots of LDL particles (i.e., apoB > 120 mg/dl), smaller peak LDL size seems to carry a much greater risk – 6.2X.
If you just looked at this figure, you might end up drawing the conclusion that both size and number are independently predictive of risk (i.e., Reason #3, above). Not an illogical conclusion…
What is not often mentioned, however, is what is in the text of the article:
“Among lipid, lipoprotein,and apolipoprotein variables, apo B [LDL-P] came out as the best and only significant predictor of ischemic heart disease (IHD) risk in multivariate stepwiselogistic analyses (P=.002).”
“LDL-PPD [peak LDL particle diameter] — as a continuous variable did not contribute to the risk of IHD after the contribution of apo B levels to IHD risk had been considered.”
What’s a continuous variable? Something like height or weight, where the possible values are infinite between a range. Contrast this with discrete variables like “tall” or “short,” where there are only two categories. For example, if I define “tall” as greater than or equal to 6 feet, the entire population of the world could be placed in two buckets: Those who are “short” (i.e., less than 6 feet tall) and those who are “tall” (i.e., those who are 6 feet tall and taller). This figure shows LDL size like it’s a discrete variable – “large” or “small” – but obviously it is not. It’s continuous, meaning it can take on any value, not just “large” or “small.” When this same analysis is done using LDL size as the continuous variable it is, the influence of size goes away and only apoB (i.e., LDL-P) matters.
This effect has been observed subsequently, including the famous Multi-Ethnic Study of Atherosclerosis (MESA) trial, which you can read here. The MESA trial looked at the association between LDL-P, LDL-C, LDL size, IMT (intima-media thickness – the best non-invasive marker we have for atherosclerosis), and many other parameters in about 5,500 men and women over a several year period.
This study used the same sort of statistical analysis as the study above to parse out the real role of LDL-P versus particle size, as summarized in the table below.
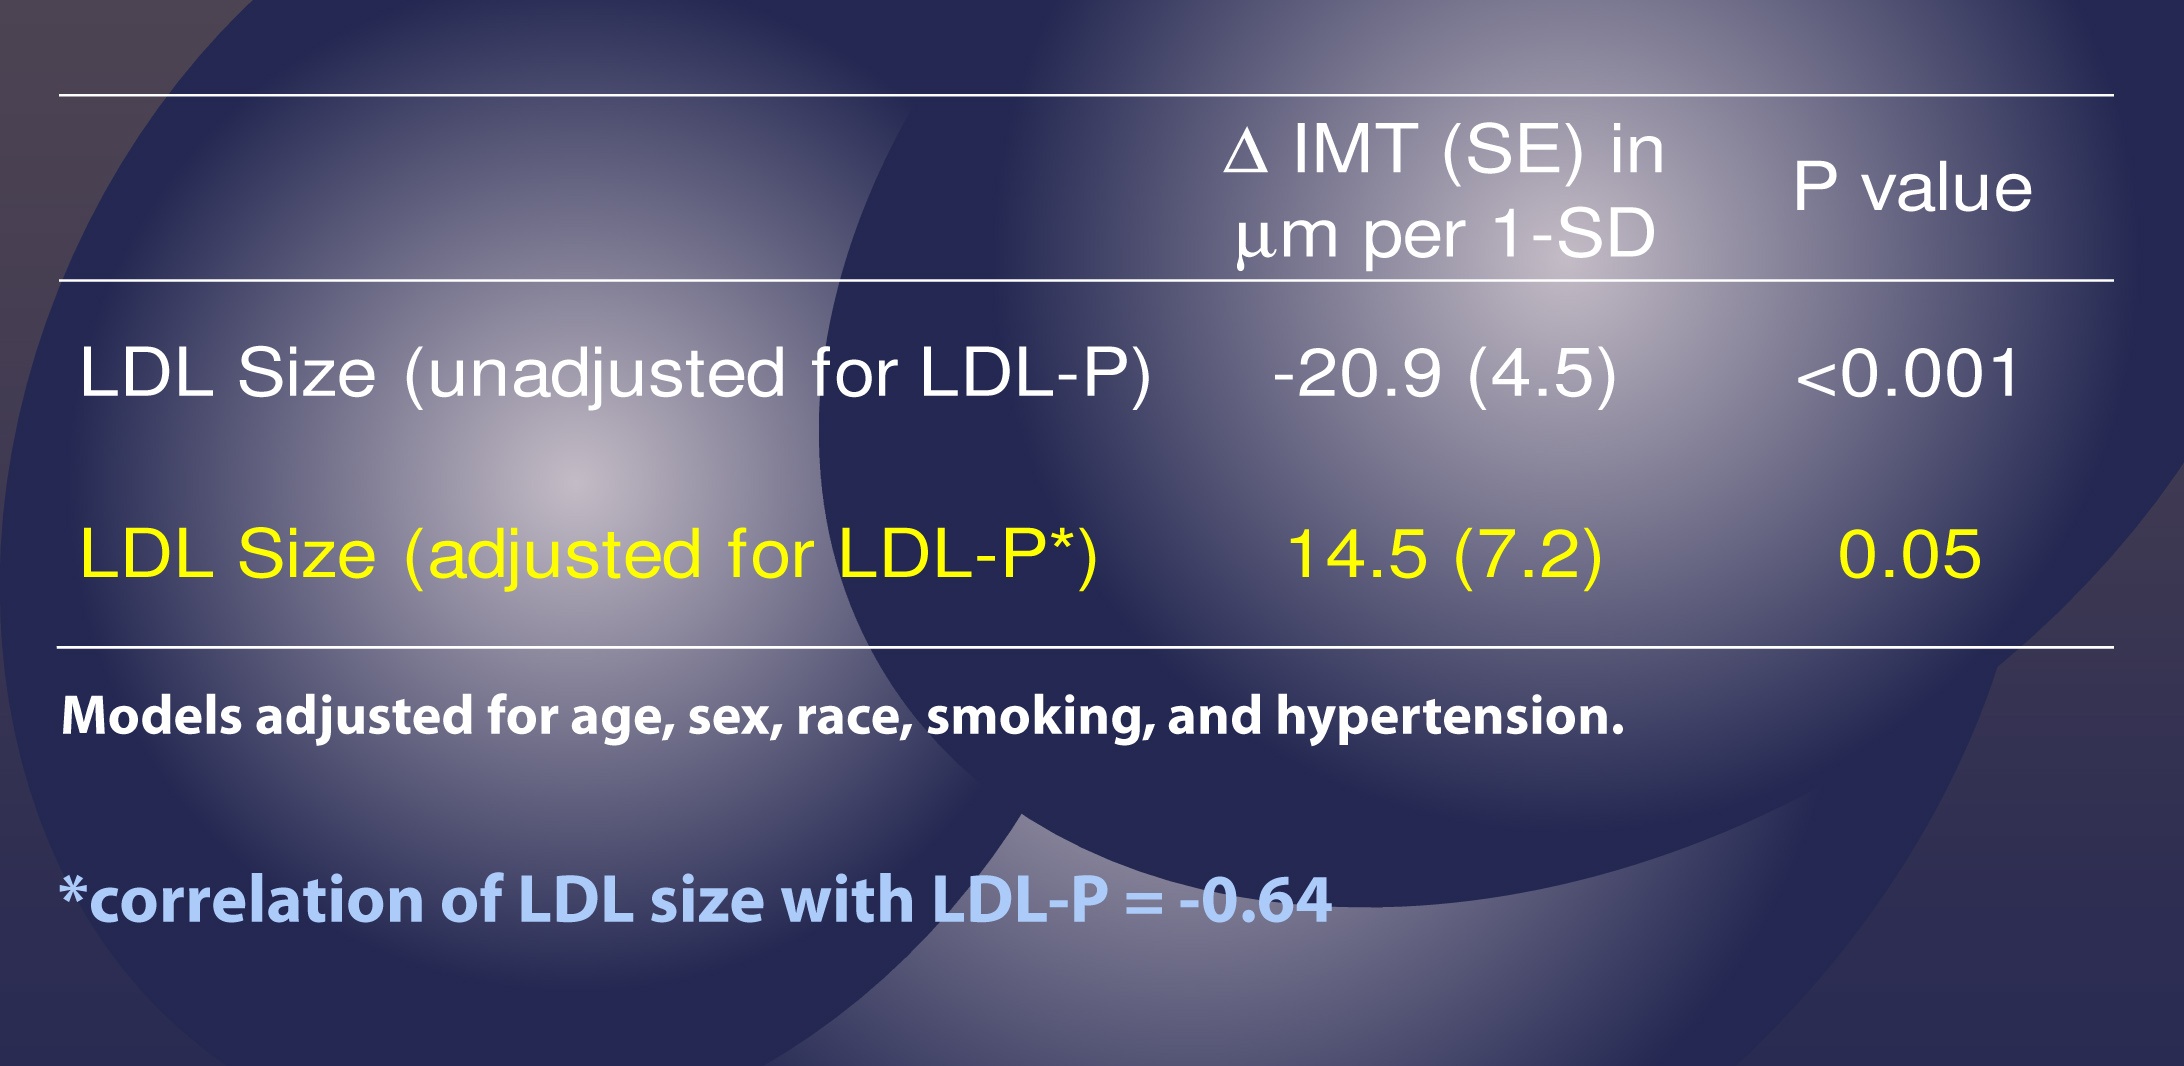
This table shows us that when LDL-P is NOT taken into account (i.e., “unadjusted” analysis), an increase of one standard deviation in particle size is associated with 20.9 microns of LESS atherosclerosis, what one might expect if one believes particle size matters. Bigger particles, less atherosclerosis.
However, and this is the important part, when the authors adjusted for the number of LDL particles (in yellow), the same phenomenon was not observed. Now an increase in LDL particle size by 1 standard deviation was associated with an ADDITIONAL 14.5 microns of atherosclerosis, albeit of barely any significance (p=0.05).
Let me repeat this point: Once you account for LDL-P, the relationship of atherosclerosis to particle size is abolished (and even trends towards moving in the “wrong” direction – i.e., bigger particles, more atherosclerosis).
Let me use another analysis to illustrate this point again. If you adjust for age and sex, but not LDL-P [left graph, below], changes in the number of LDL particles (shown in quintiles, so each group shows changes by 20% fractions) seem to have no relationship with IMT (i.e., atherosclerosis).
However, when you adjust for small LDL-P [right graph, below], it becomes clear that increased numbers of large LDL particles significantly increase risk.
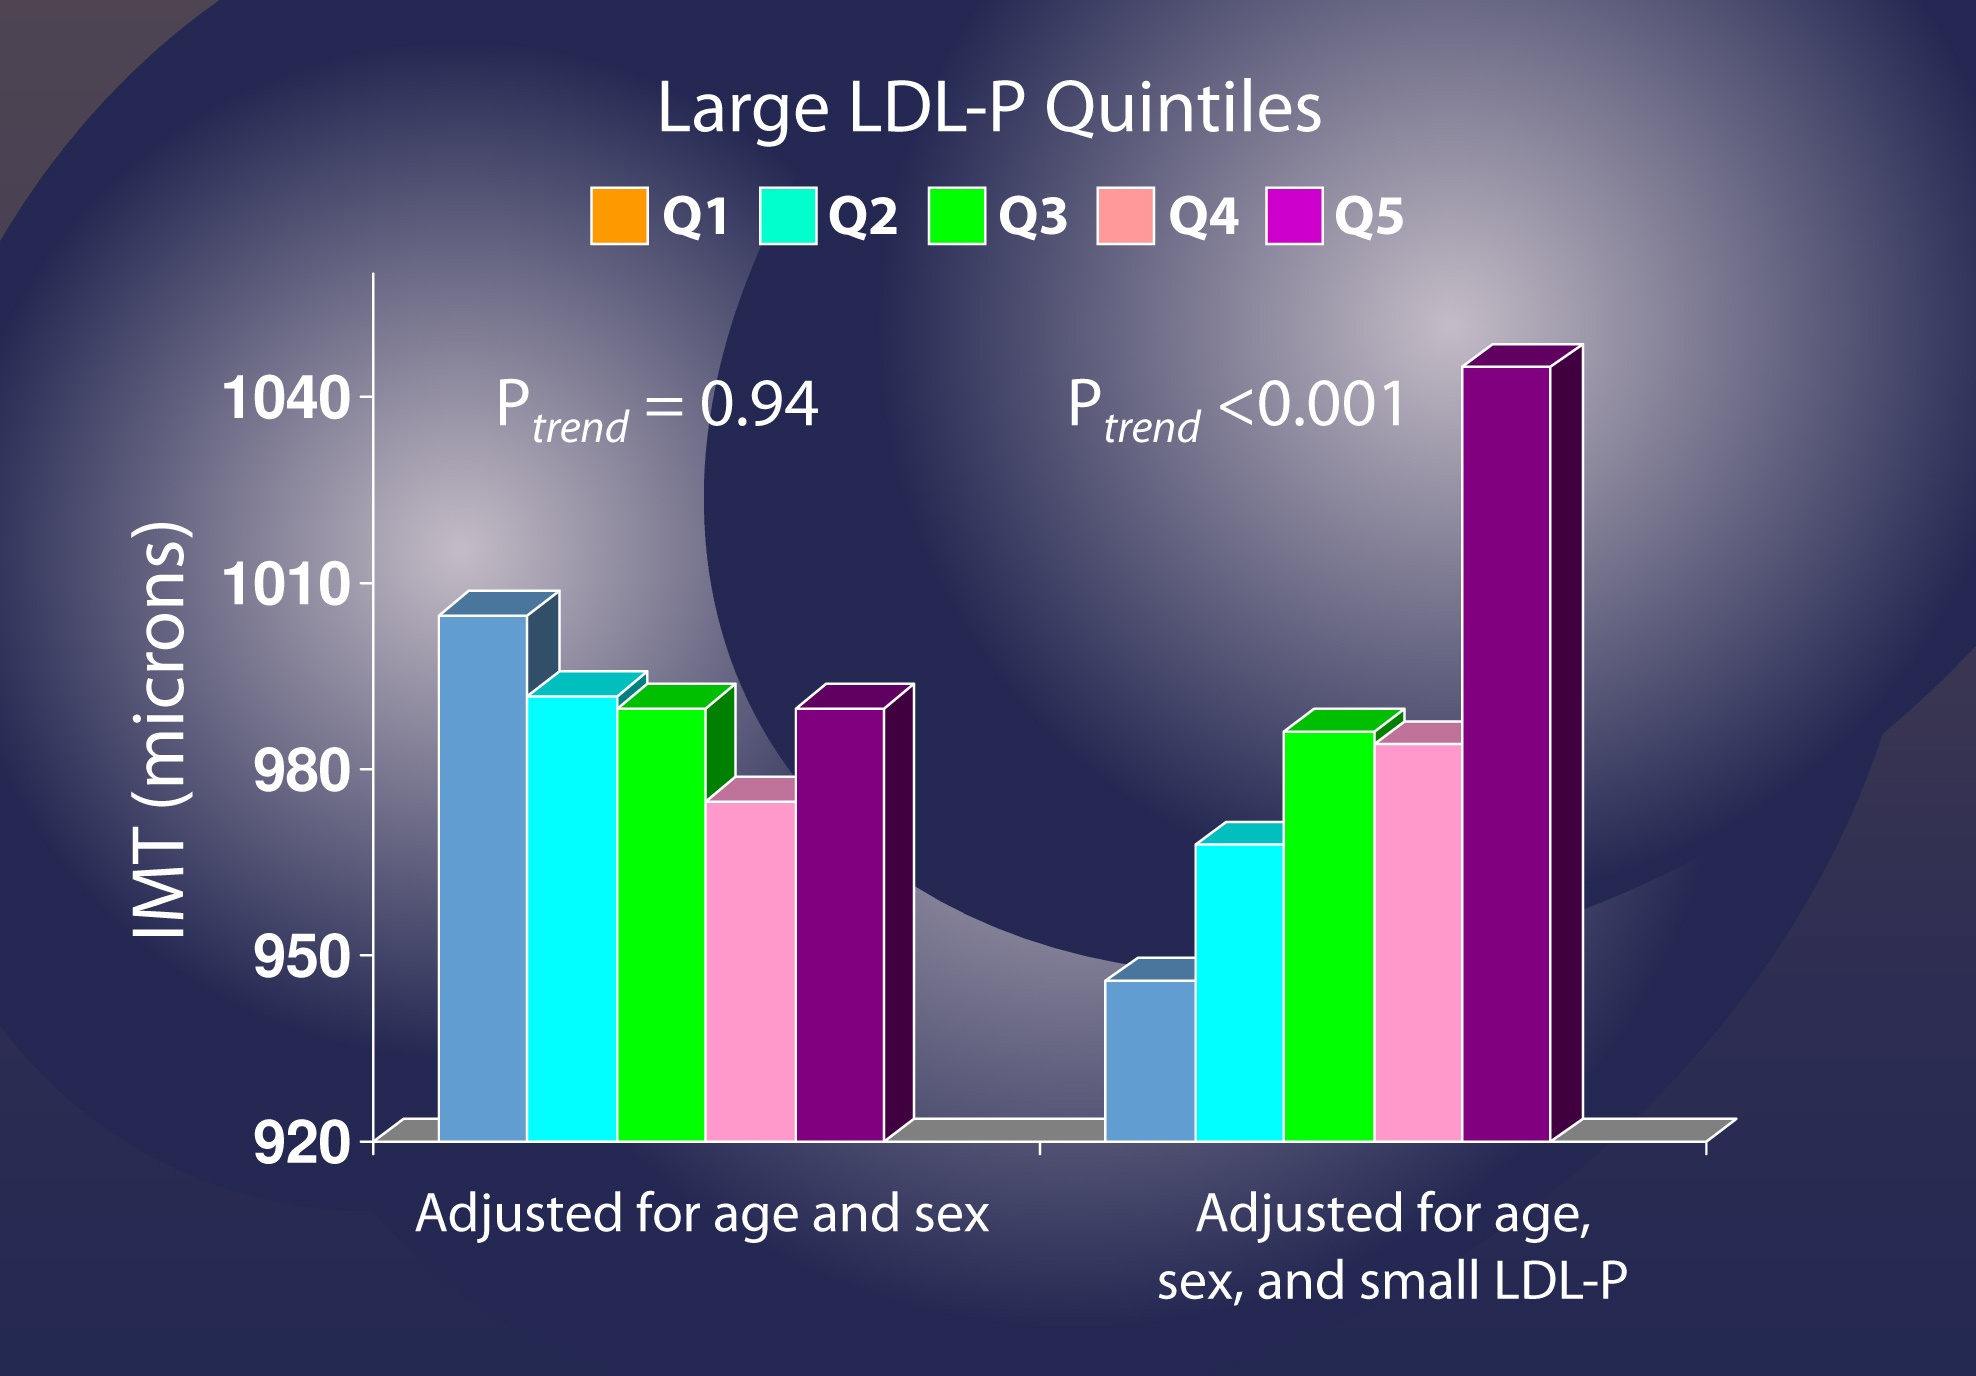
I’ve only covered a small amount of the work addressing this question, but this issue is now quite clear. A small LDL particle is no more atherogenic than a large one, but only by removing confounding factors is this clear. So, if you look back at the figure I used to address this question, it should now be clear that Reason #2 is the correct one.
This does not imply that the “average” person walking around with small particles is not at risk. It only implies the following:
- The small size of their particles is probably a marker for something else (e.g., metabolic derangement due to higher trafficking of triglycerides within LDL particles);
- Unless you know their particle number (i.e., LDL-P or apoB), you actually don’t know their risk.
Let’s wrap it up here for this week. Next week we’ll address another question that’s probably been on your mind: Why do we need to measure LDL-P or apoB? Isn’t the LDL-C test my doctor orders enough to predict my risk?
Summary
- At first glance it would seem that patients with smaller LDL particles are at greater risk for atherosclerosis than patients with large LDL particles, all things equal. Hence, this idea that Pattern A is “good” and Pattern “B” is bad has become quite popular.
- To address this question, however, one must look at changes in cardiovascular events or direct markers of atherosclerosis (e.g., IMT) while holding LDL-P constant and then again holding LDL size constant. Only when you do this can you see that the relationship between size and event vanishes. The only thing that matters is the number of LDL particles – large, small, or mixed.
- “A particle is a particle is a particle.” If you don’t know the number, you don’t know the risk.
By NASA Mercury image: JHUAPLVenus image: JPLMars image: HST [Public domain], via Wikimedia Commons


I can’t understand the second figure and it’s freaking pissing me off. Can someone please explain!
Sorry I read this article in two sessions. It’s the LAST figure with the quintiles.
If one is already on statin therapy, is it possible to get a handle on the LDL-P count that may be better addressed by medication that targets LDL-P instead of LDL-C?
This seems to say that of two people with same mg/dl, the one with smaller particles is more at risk. That’s the example you started with. The distinction I guess is that it isn’t the size that is the problem but the number?
Not entirely…remember Pattern A vs. Pattern B is not the causative issue. Pattern B is a marker for folks more particles, but the size isn’t causing the problem. The problem with LDL’s (vs. HDL’s) is that they not only penetrate the endothelium, but they often remain there AND deposit their cholesterol there. HDL’s do not.
why did my tg and ldl go up hdl went down
Hmm… so HDLs don’t get gobbled up in foam cells? Why is that?
Dr., Are LDL particles large or small or should I say can they be large or small particles?
Thanks,
Doug
They do not get oxidized as LDL’s do, and do not bind to arterial wall proteoglycans nor are they internalized by macrophages the way the apoB species are.
LIkely they carry antioxidative proteins and are not subject to reactive oxygen species. The surface receptrs on a macrophage look for oxidized lipoproteins
When TG rise, they invade HDL particles and knocks their cholesterol out. The TG-rich HDL is subject to catbolism and renal excretion of apoA-I (the HDL surface structural protein)
Dr Lipid,
Do you have a lecture up on VLDL formation? I am interested to understand the LDL precursor birth, and the role of TG. TG tends to be high for those on high carbohydrate diets, and mine (predictably) dropped like a stone when I started carbohydrate restriction.
Since VLDL production is a key to LDL-P, lets explore this…
1) Why is TG so high in a fasted state when you eat a high carb diet or are insulin resistant?
2) Can excess denovo lipogenesis account for the magnitude of TG increases in a high carb diet?
3) Can elevated TG represent signs of fatty liver on the way to healing? Presumably the liver would need to export excess TG out via VLDL…
4) Is the liver mopping up excess circulating NEFA and wrapping them into TG and sending them out in apoB particles? I’ve heard some suggestion that TG rises in the mornings for insulin resistant people because fat cells dump as much NEFA as they can during low insulin states (overnight) to help feed insulin resistant cells like muscle cells during the day. Does the liver mop up excess NEFA and repackage them into VLDL?
5) Or some other reasons?